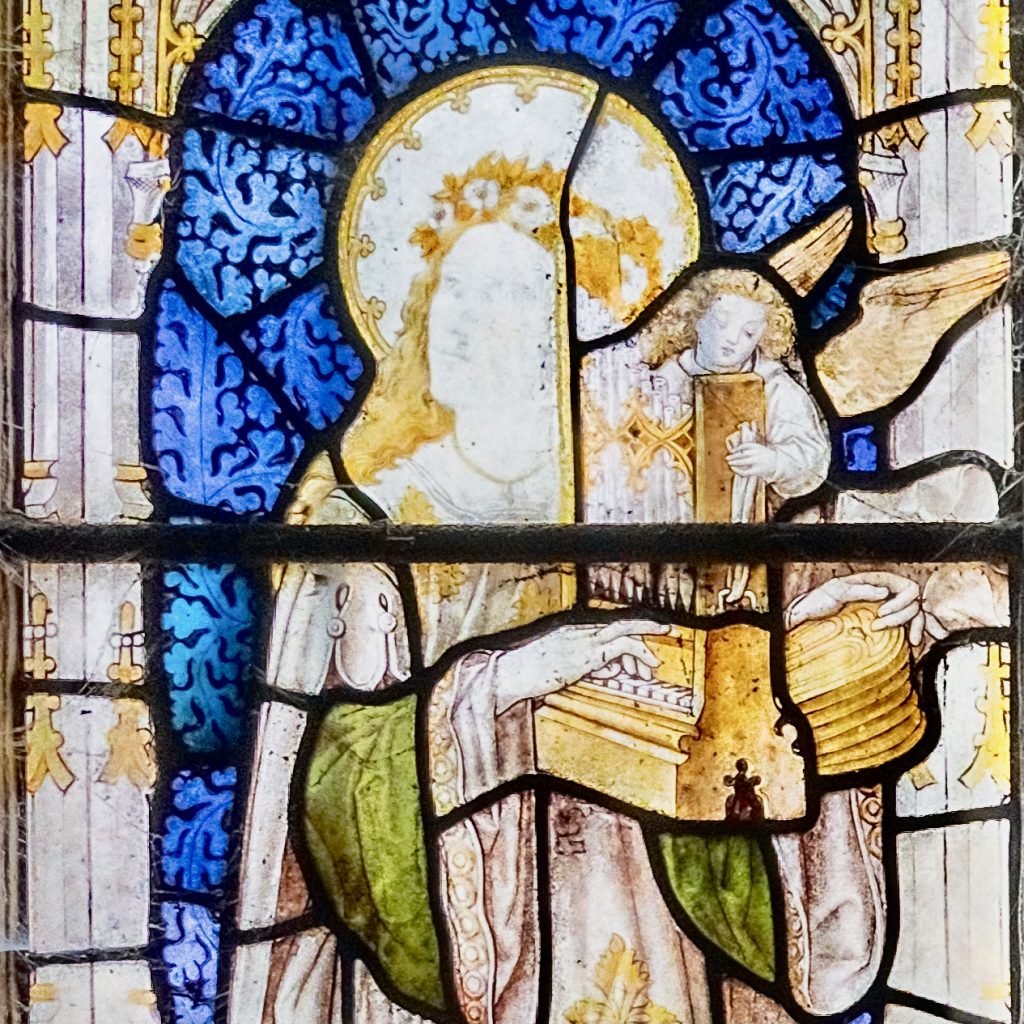
The Music of Hildegard of Bingen will be played at Eccleston Church of St Mary’s, Chester on 1st April 2024. Tickets are available from the Church Warden from March.
The Music of Hildegard of Bingen will be played at Eccleston Church of St Mary’s, Chester on 1st April 2024. Tickets are available from the Church Warden from March.

Thinkest thou that I cannot now pray to my father and he shall presently give me more than twelve legions of angels.
Matthew 26:53
That night the angel of the Lord went out and put to death a hundred and eighty five thousand in the Assyrian camp
2 Kings 19:35
Back in the day, a Roman legion was approximately 6000 soldiers. 12 legions would have been 72,000 soldiers. 2 Kings 19:35 tells us that 1 angel is approximately equivalent in strength to 185,000 men. Therefore 12 legions of angels would be equivalent to 72,000 x 185,000 men. Or 13.32 billion.
At the moment, the population of the world is 7.9 billion. I find comfort in knowing who is in control.

The life of mortals is like grass, they flourish like a flower of the field; the wind blows over it and it is gone, and its place remembers it no more.
Psalm 103:15


How did God turn the shadow on the steps, ten steps backwards? Did God turn back time?
‘This is the Lord’s sign to you that the Lord will do what he has promised: “I will make the shadow cast by the sun go back the ten steps it has gone down on the stairway of Ahaz.” So the sunlight went back the ten steps it had gone down’.
Isaiah 38:7

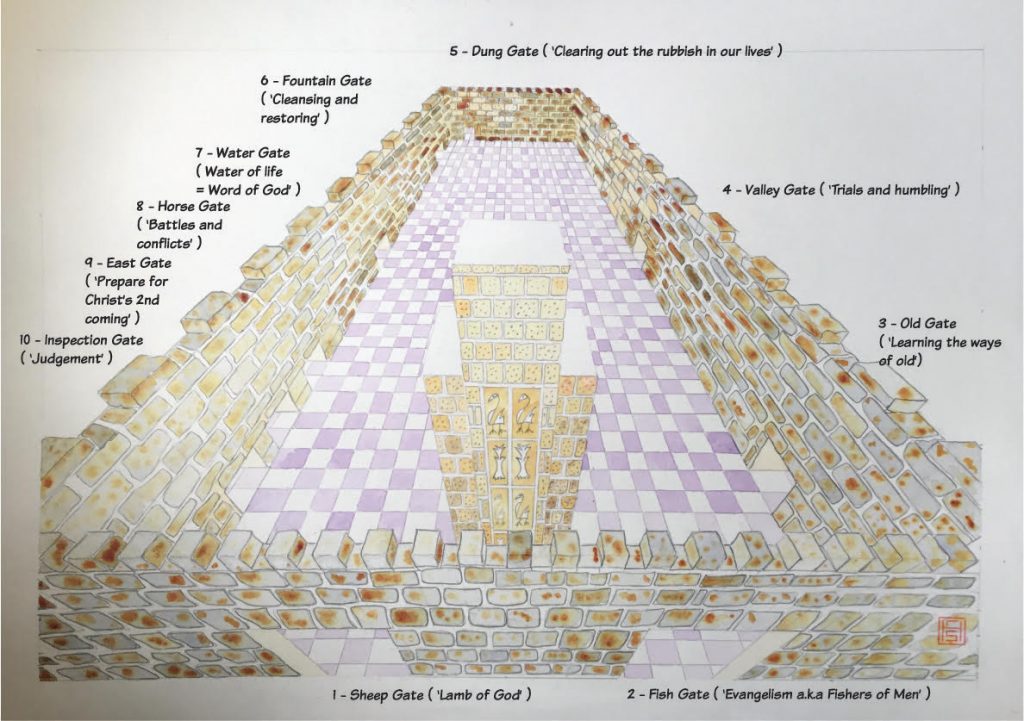
I never knew the significance of the gates on the walls of Jerusalem. Starting from gate number 1 ( the sheep gate ) and working our way around to gate number 10 ( the inspection gate ) we can chart our personal and historical progress and the significance of each gate to events in our own lives and also to events from history. What event in your life has been your ‘valley gate’? Mine was week 13 of 2015.
For a more detailed and comprehensive study, please refer to this excellent analysis at https://jesusplusnothing.com/series/post/nehem3
“The only news I know
Is bulletins all day
From immortality;
The only shows I see
Tomorrow and today,
Perchance eternity.
The only one I meet
Is God, the only street
Existence, this traversed,
If other news there be
Or admirabler show,
I’ll tell it you.”
Emily Dickinson
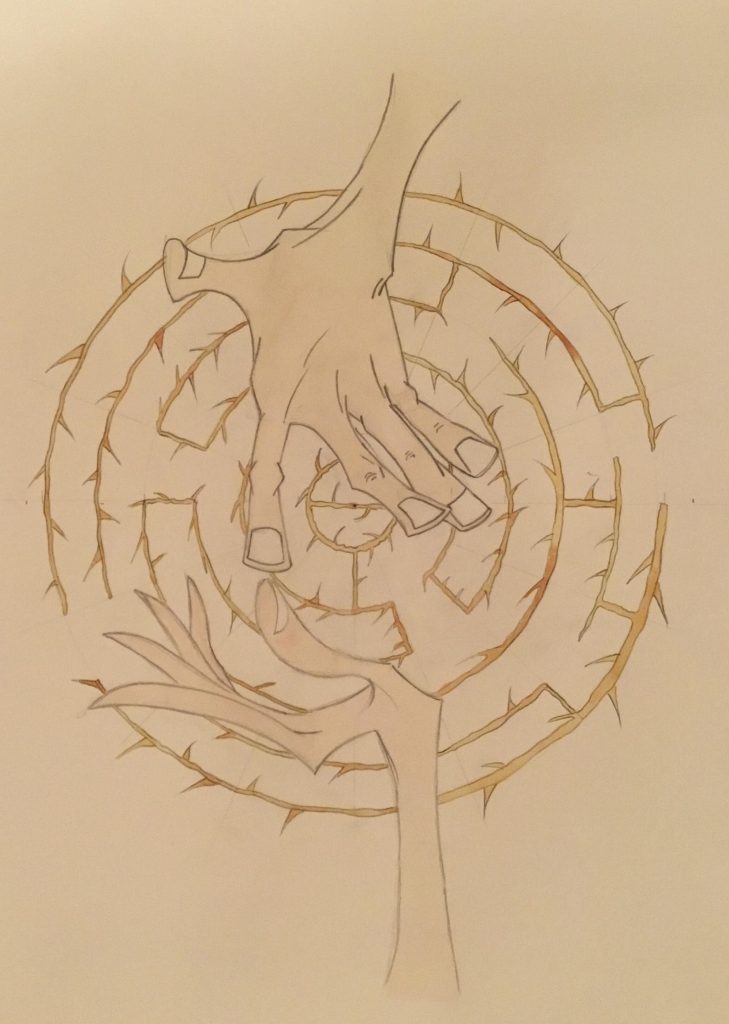
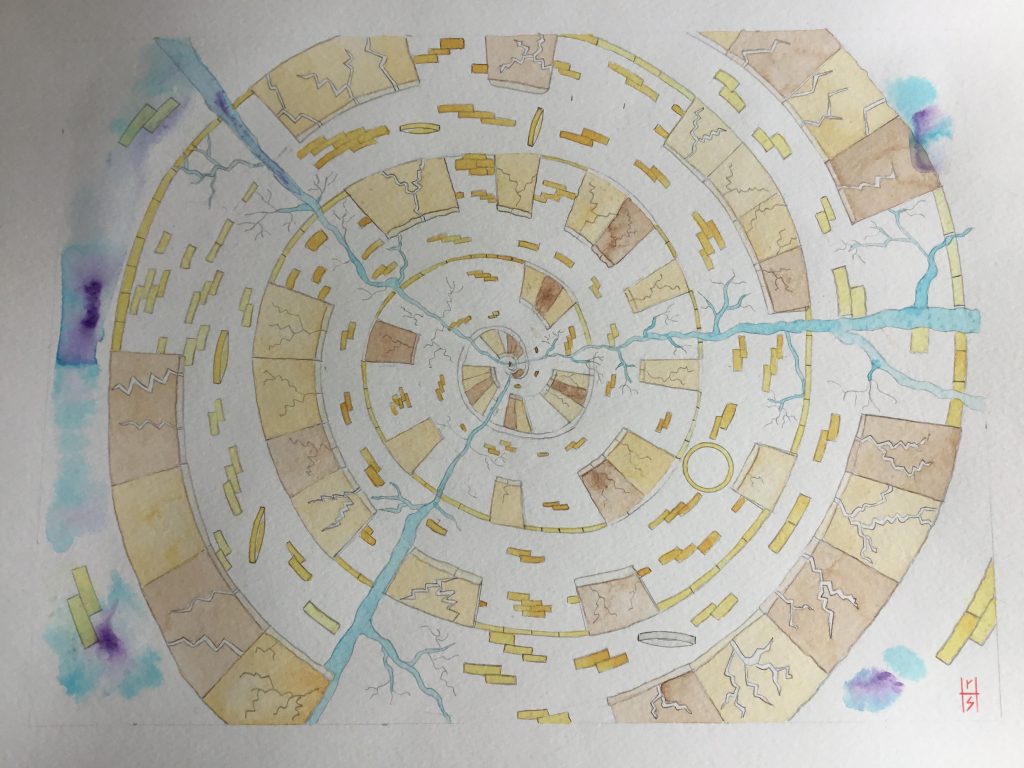
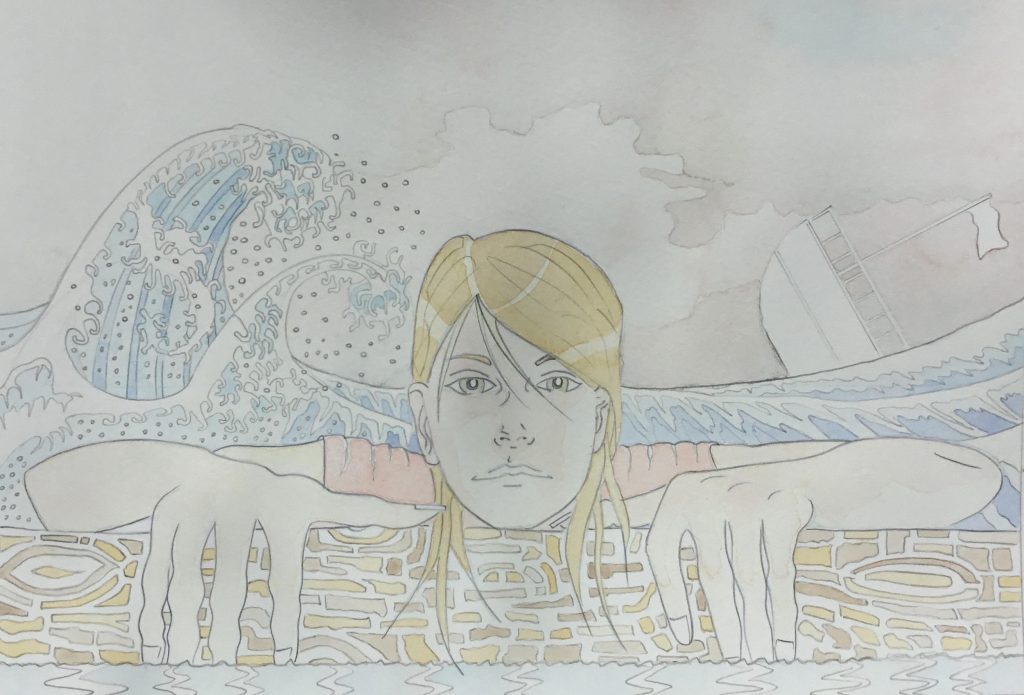
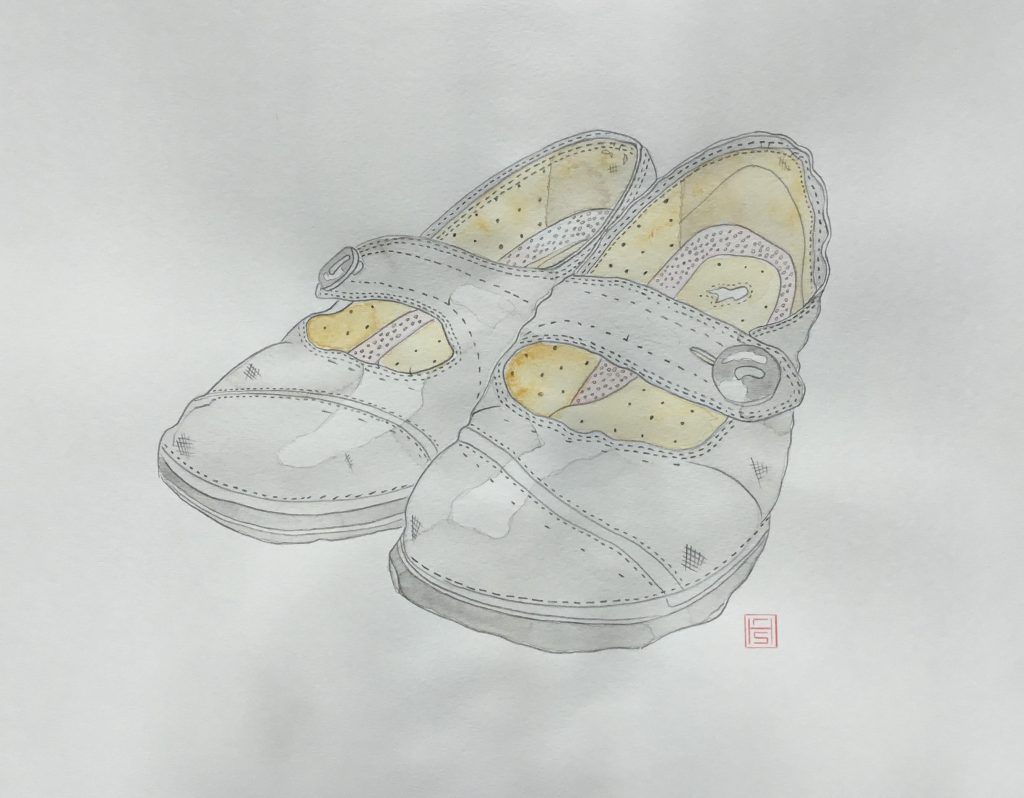
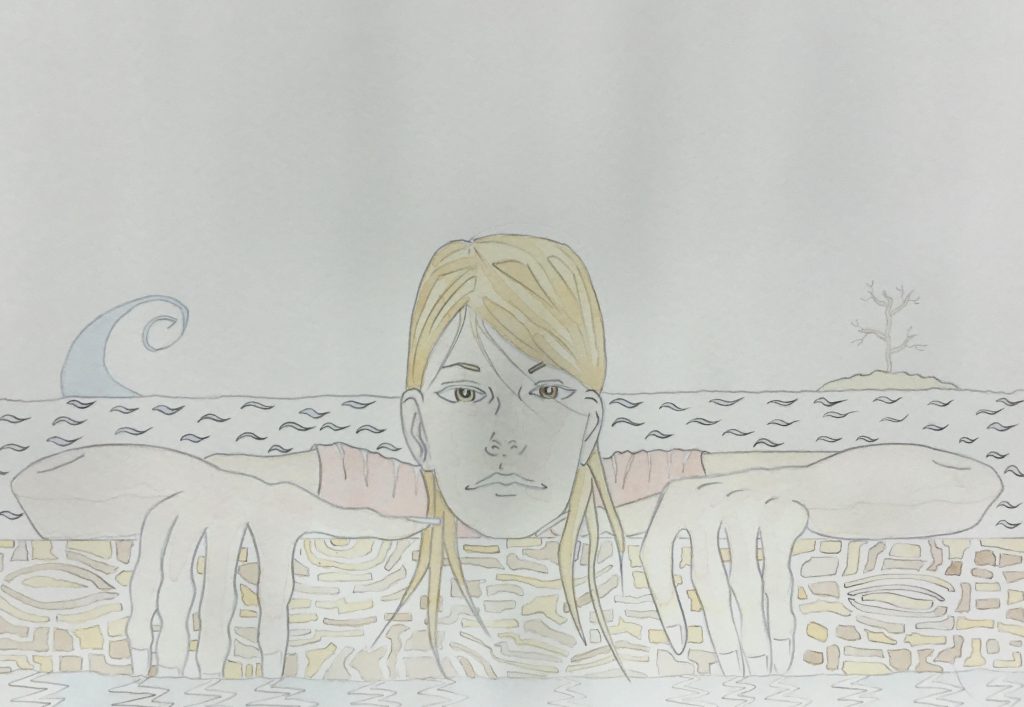
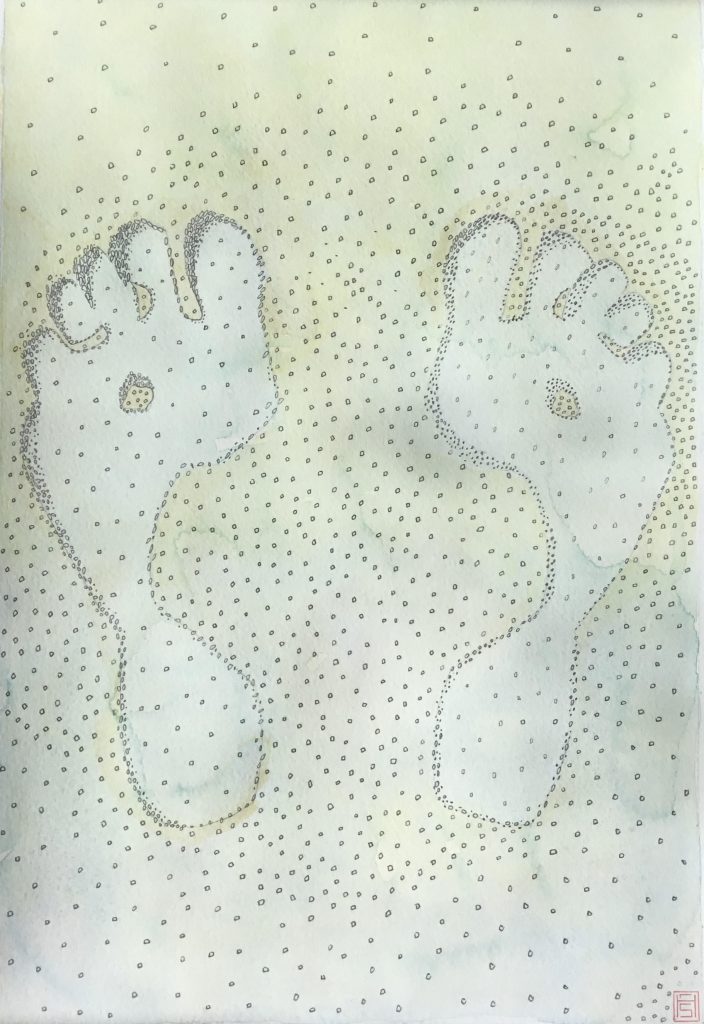
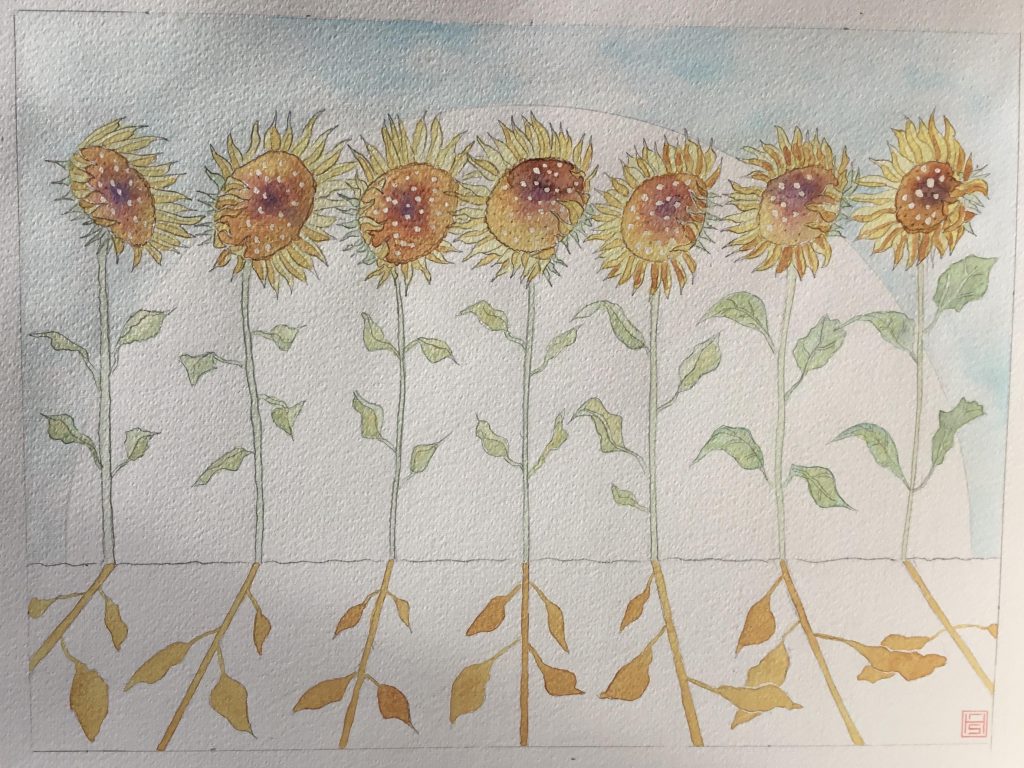
The following are some illustrations I created for a friend.